
CC Graph
CCGraph is a computational creative system I am actively developing with 2 developers at Brigham Young University. The goal of this system is to teach computers how to automatically draw better visualizations of graphs. As a computationally creative system, it is constituted by 2 main subsystems: A generator that creates visualizations of graphs based on some input graph data, and (2) an evaluator that evaluates the graphs that are generated and throws away visualizations that fail to meet specific criteria scores.
I gave the above presentation in a graduate class on computational creativity where I talk about the theory and principles behind the aesthetics of graph visualizations. The slides below are examples of specific heuristics for graph visualization aesthetics derived from the theory and principles explained in the video.
Learn more

Graph Evaluation Tool
I developed this app as a tool to help test various theories behind the graph visualization and refine our evaluation metrics.
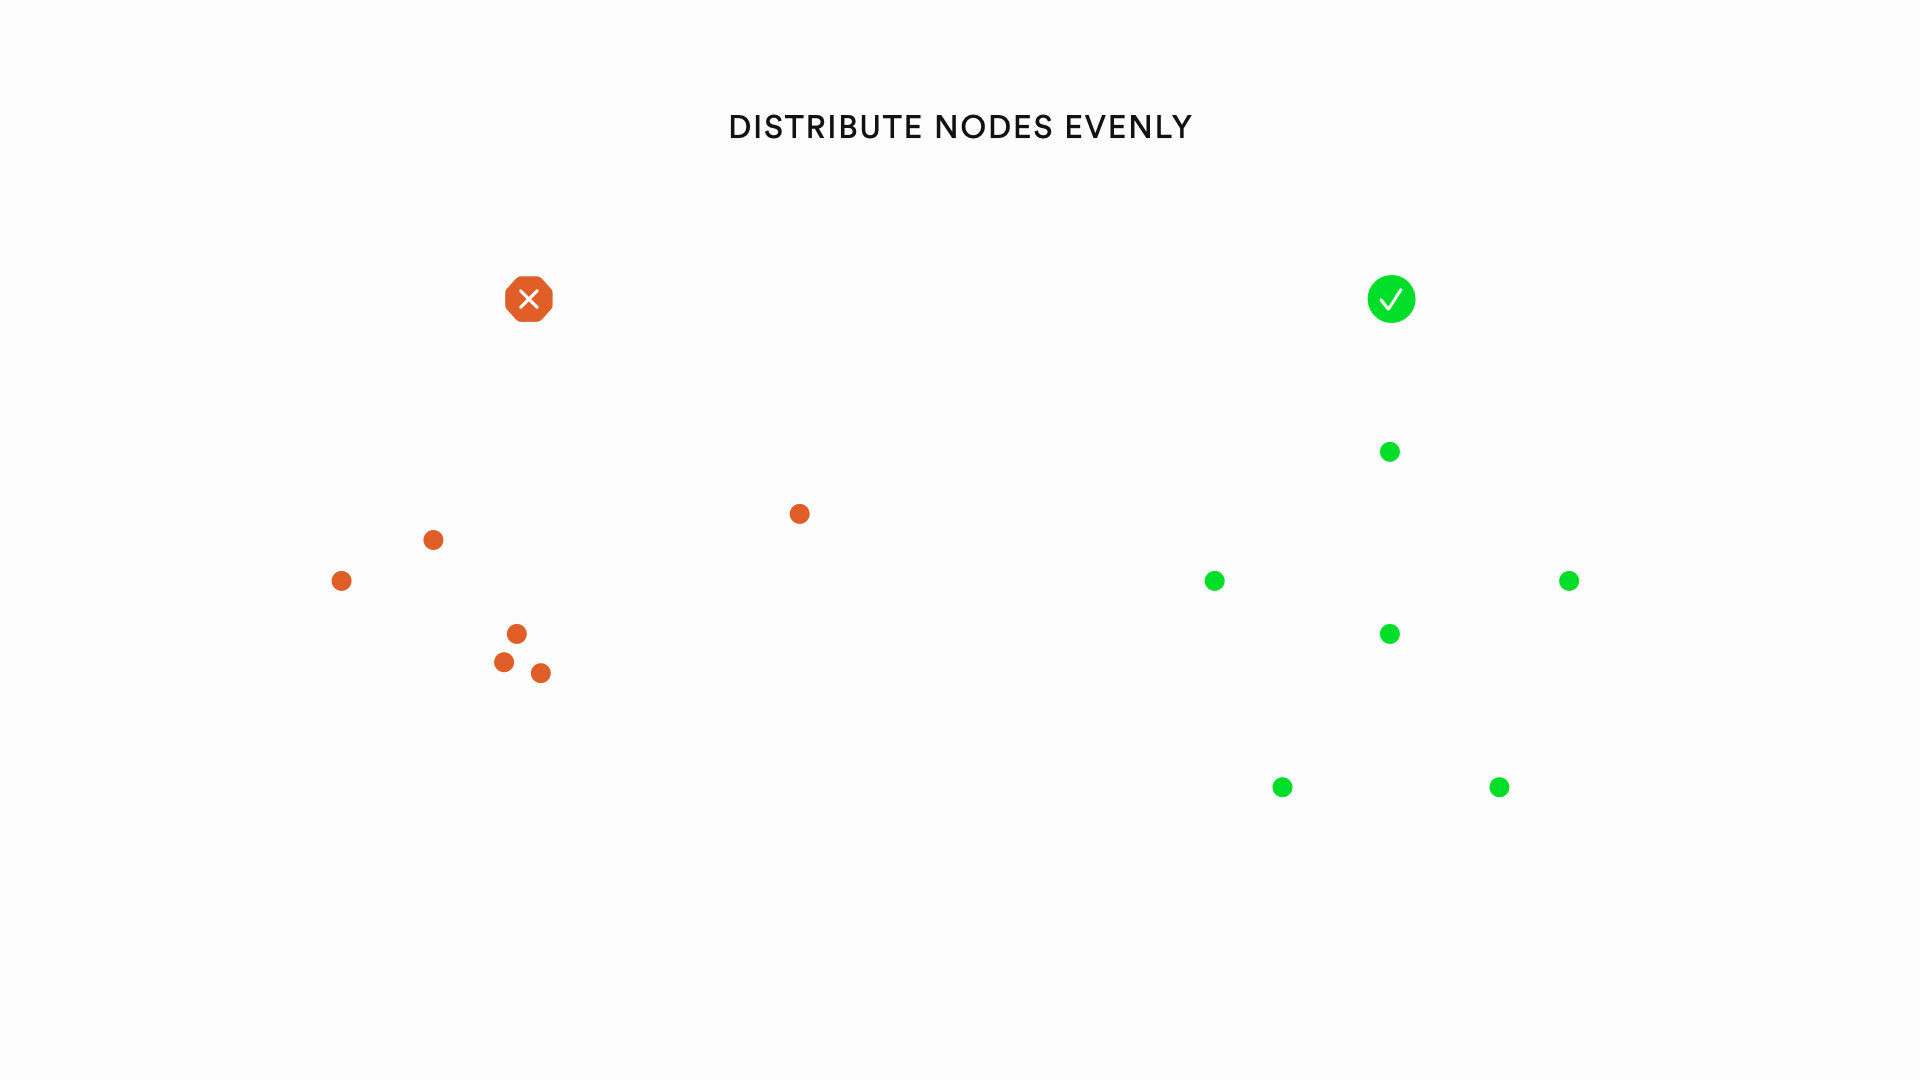
Node Placement Heuristics
• Distribute nodes evenly
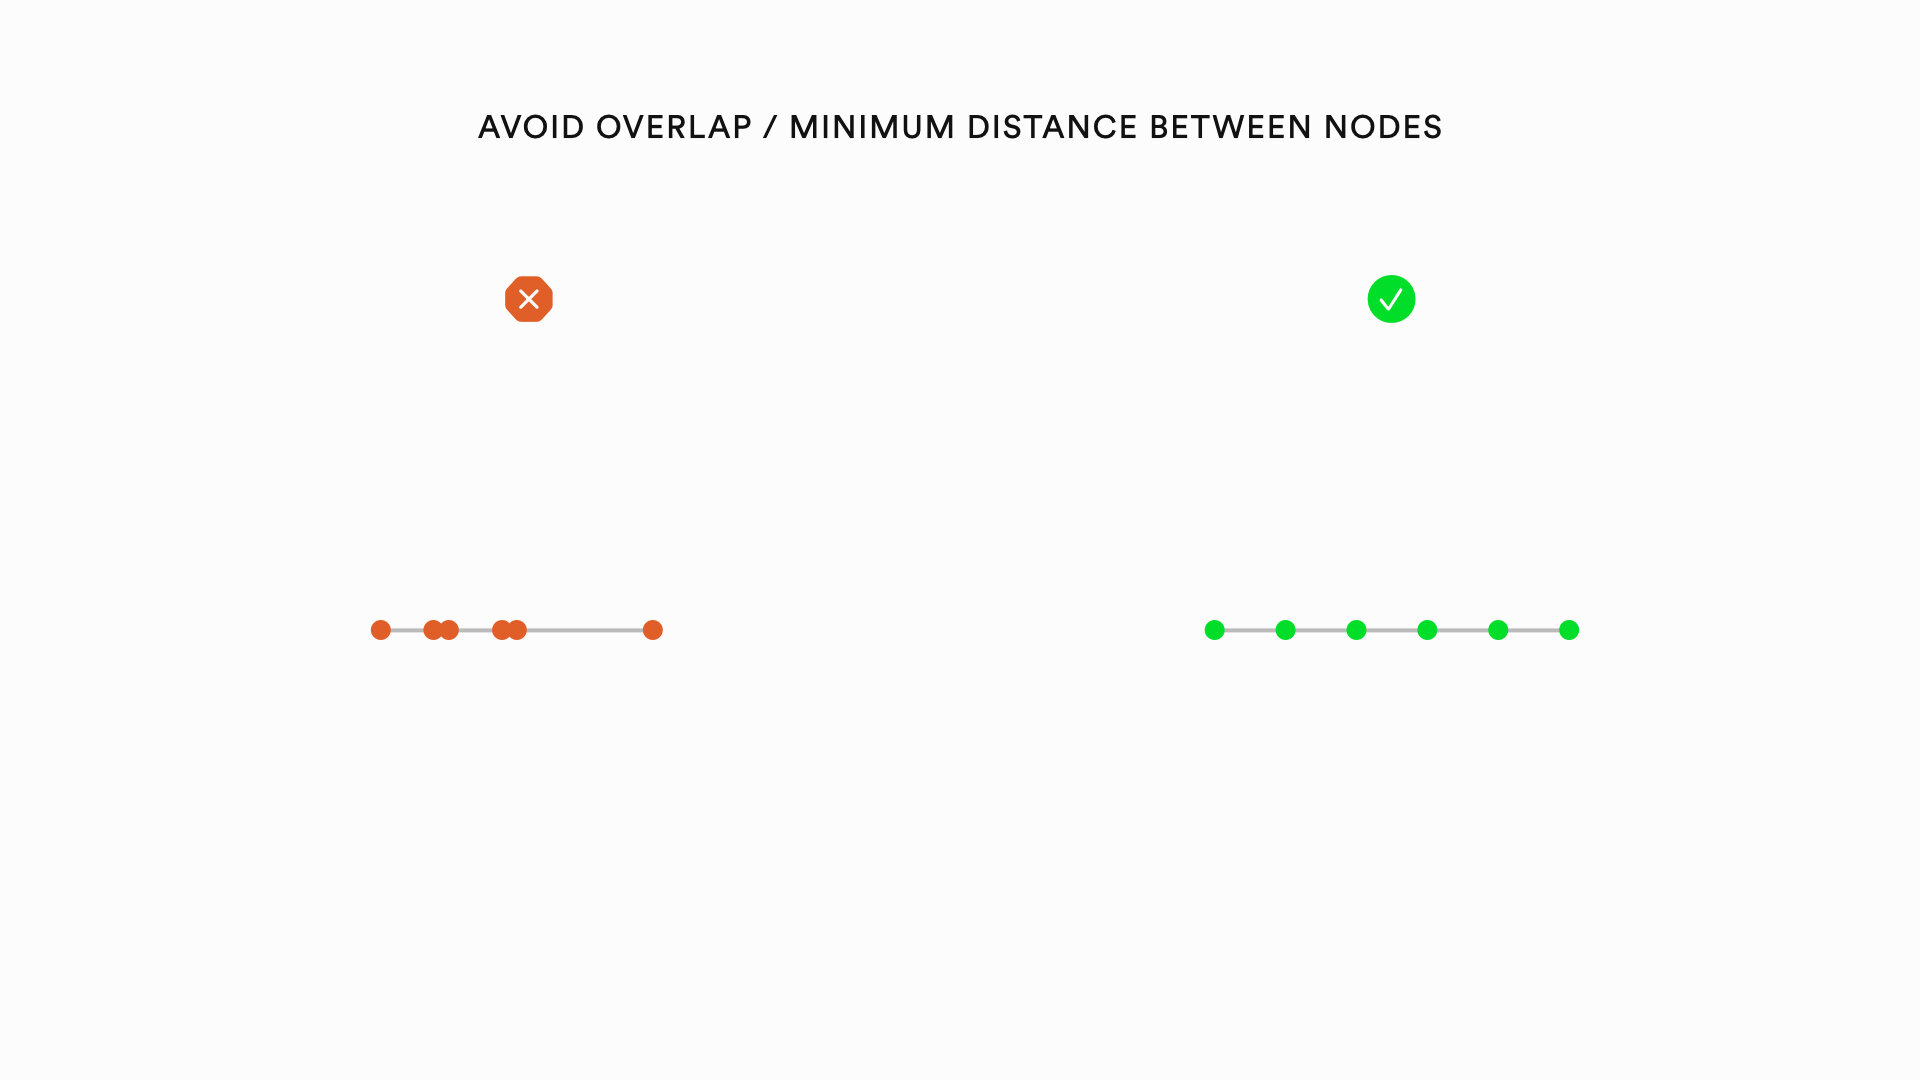
• Avoid node overlap
• Maximize minimum distance between each node
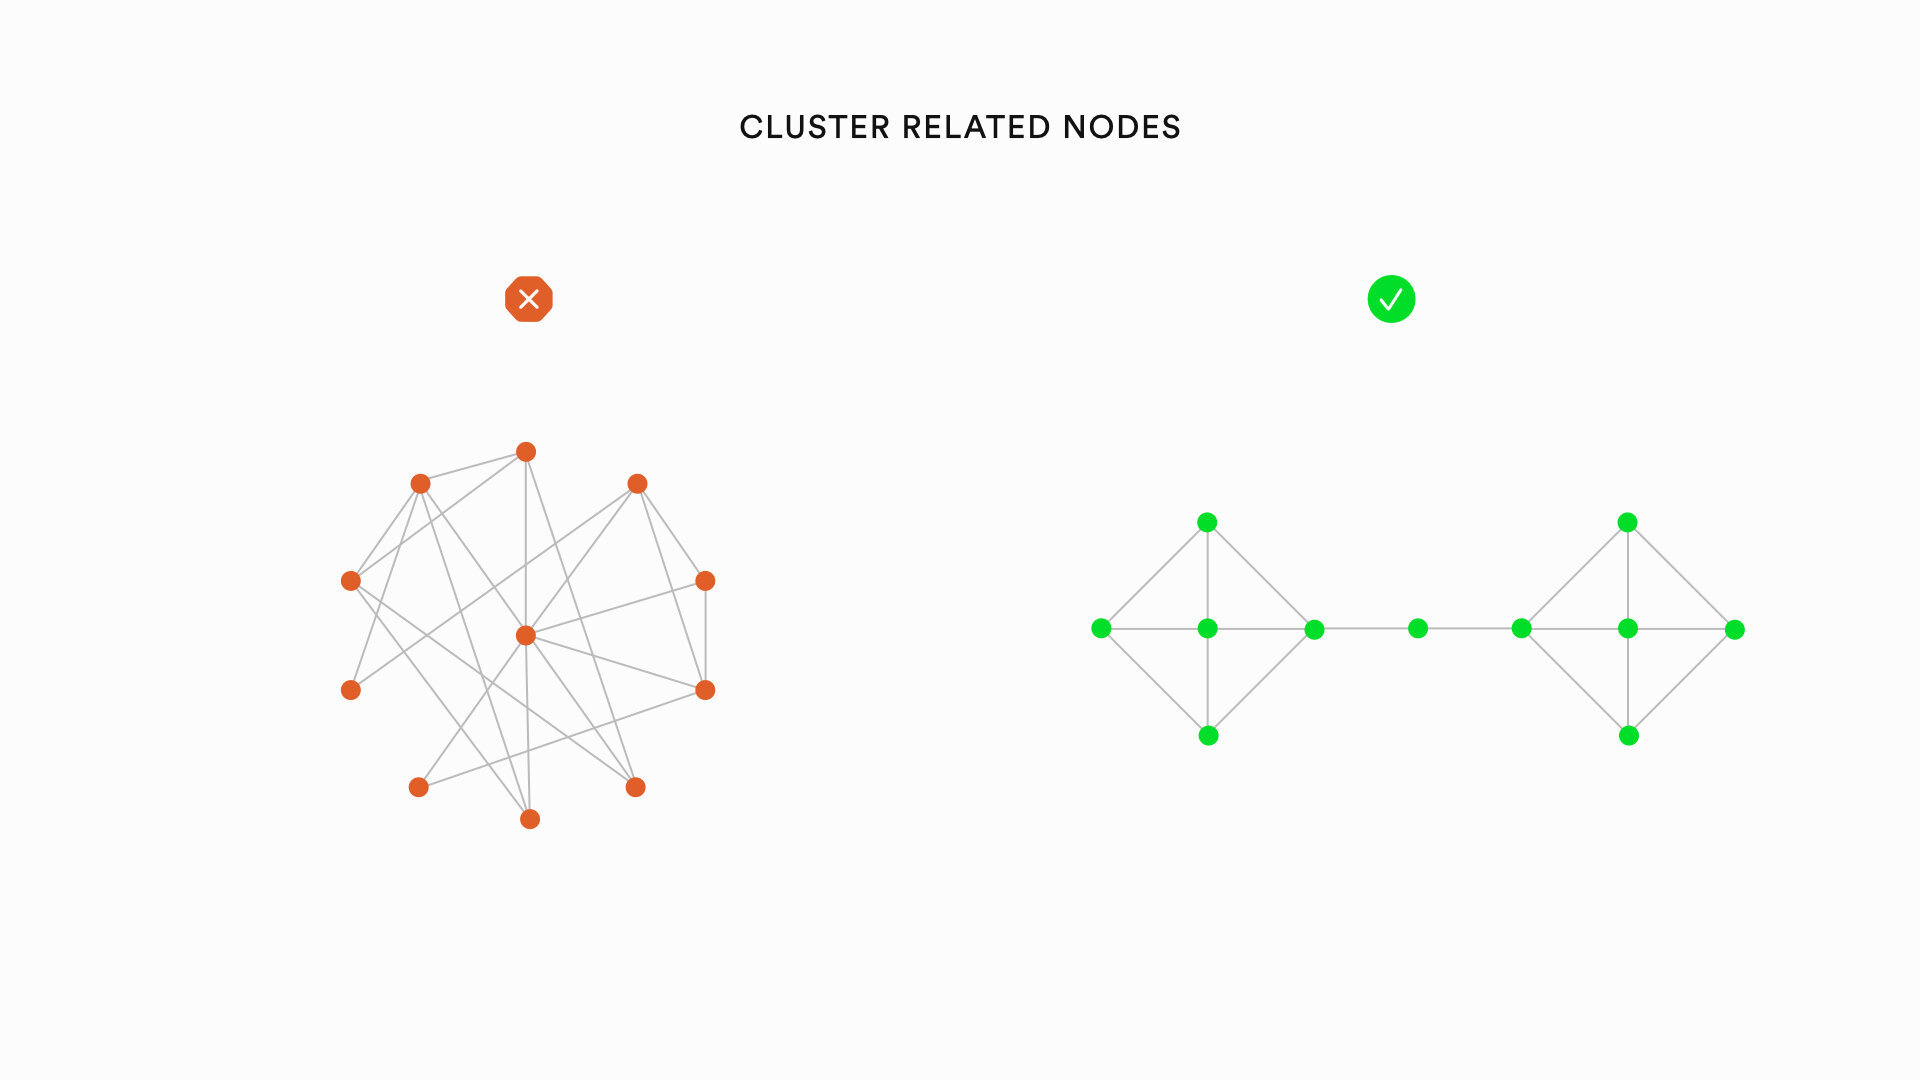
• Cluster related nodes
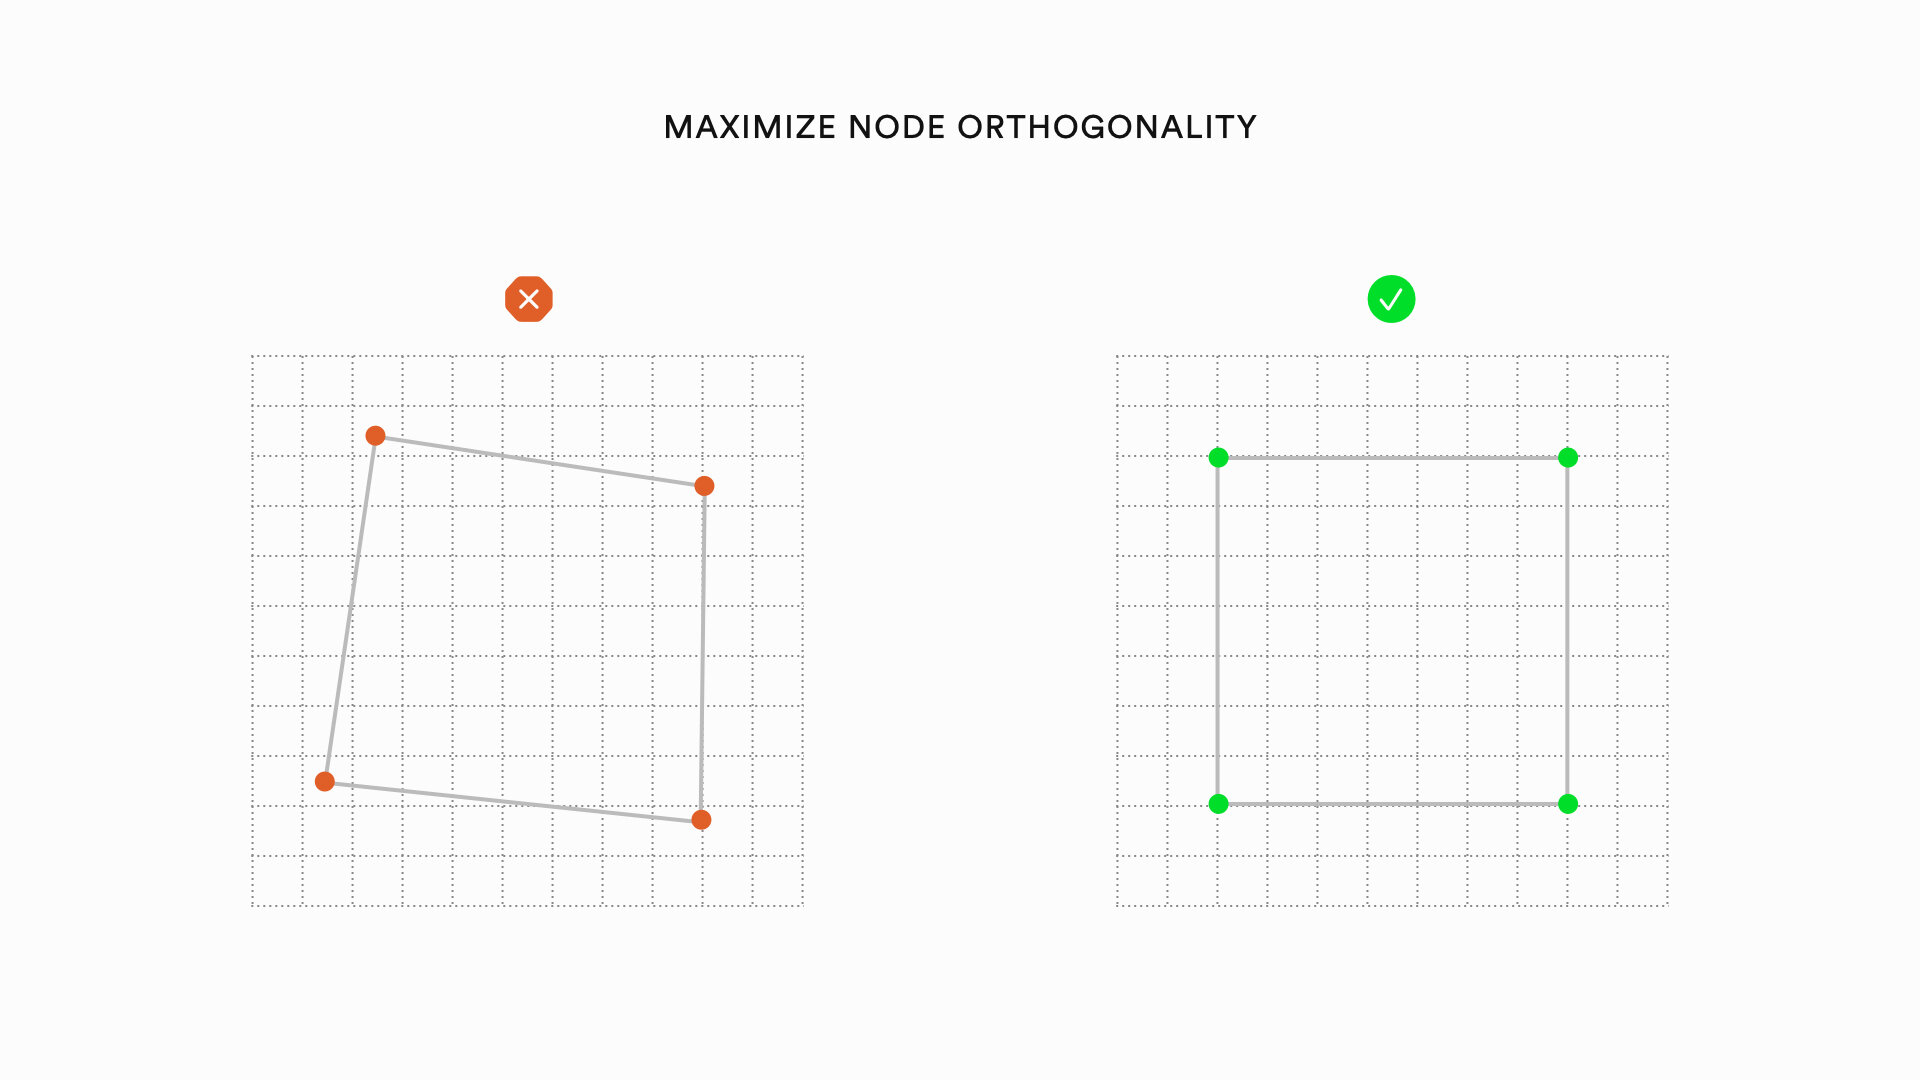
• Maximize node orthogonality
Edge Heuristics
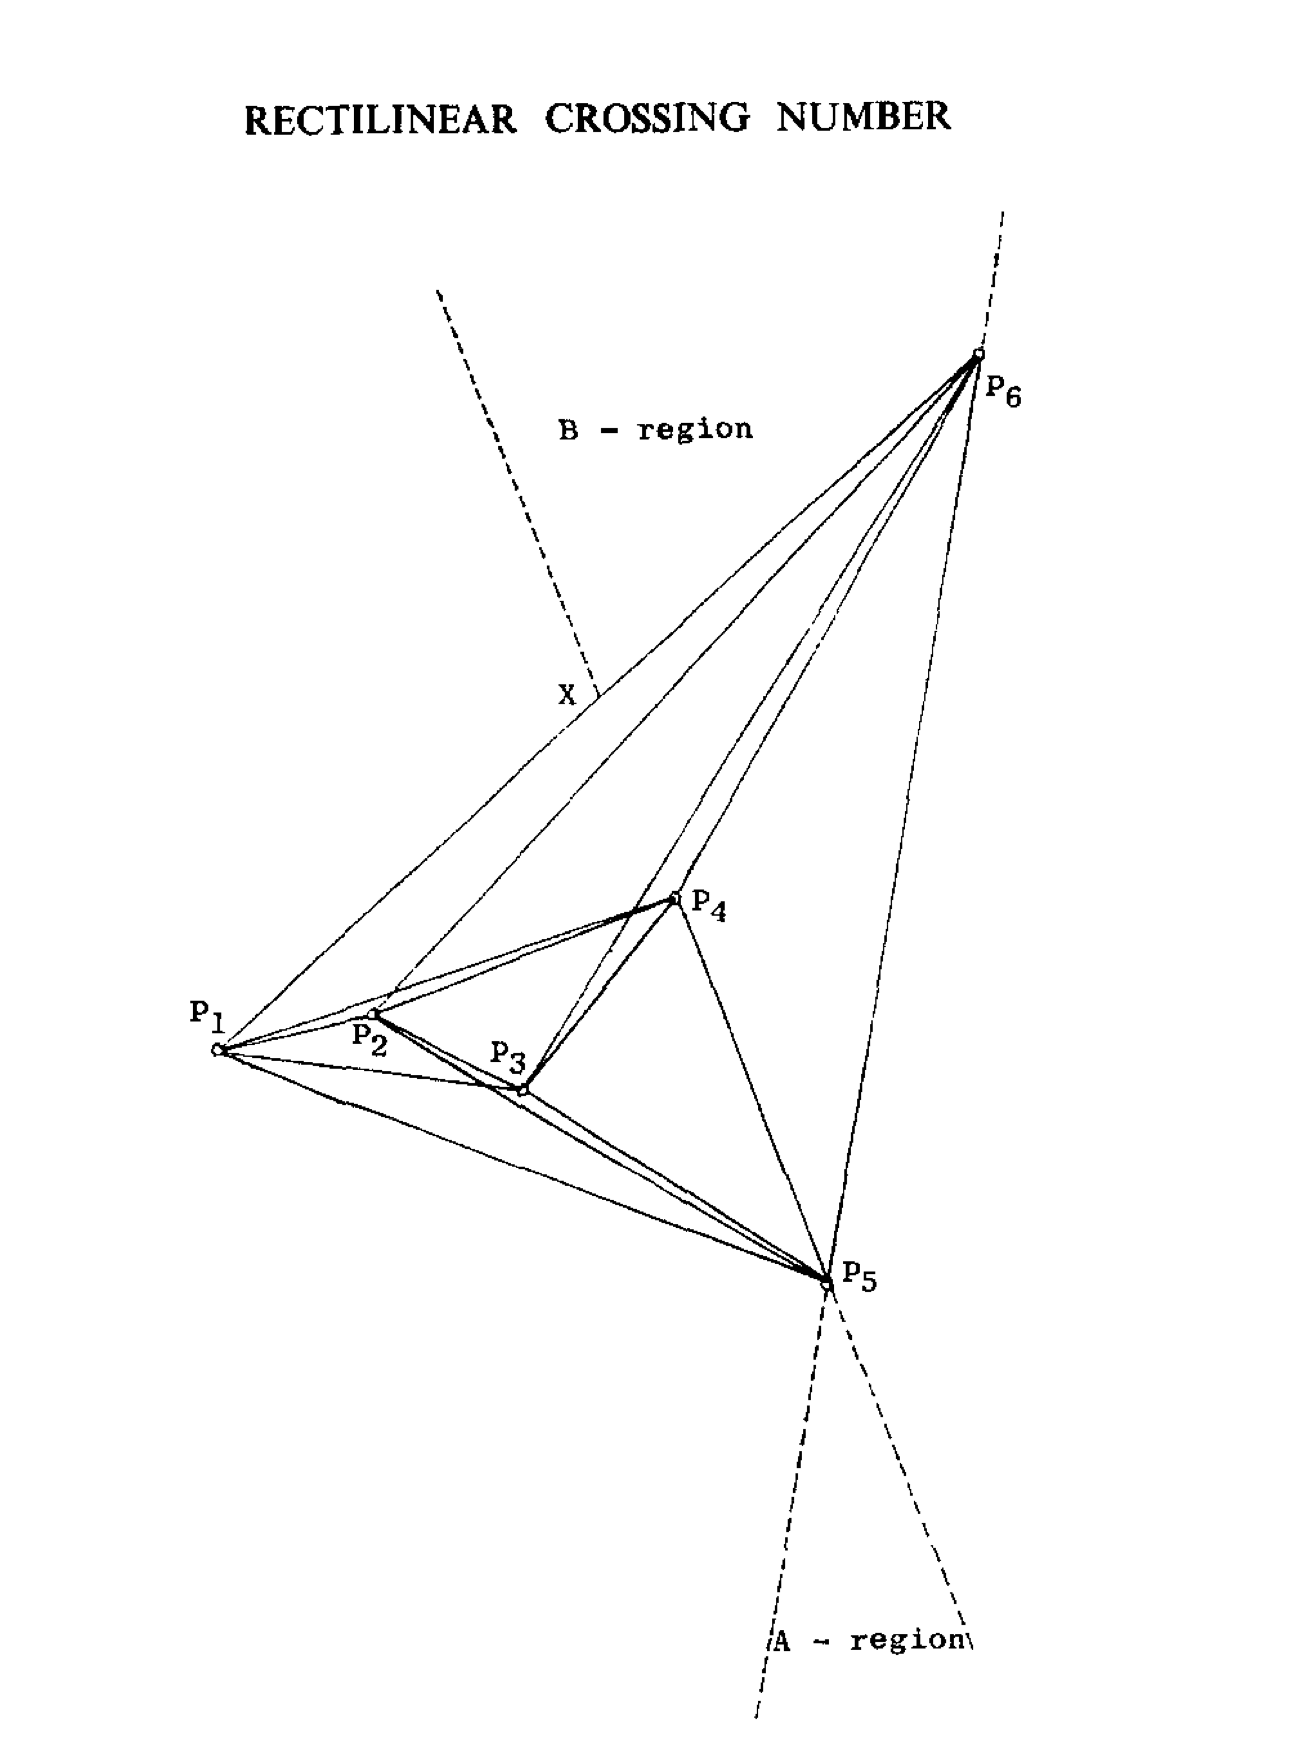
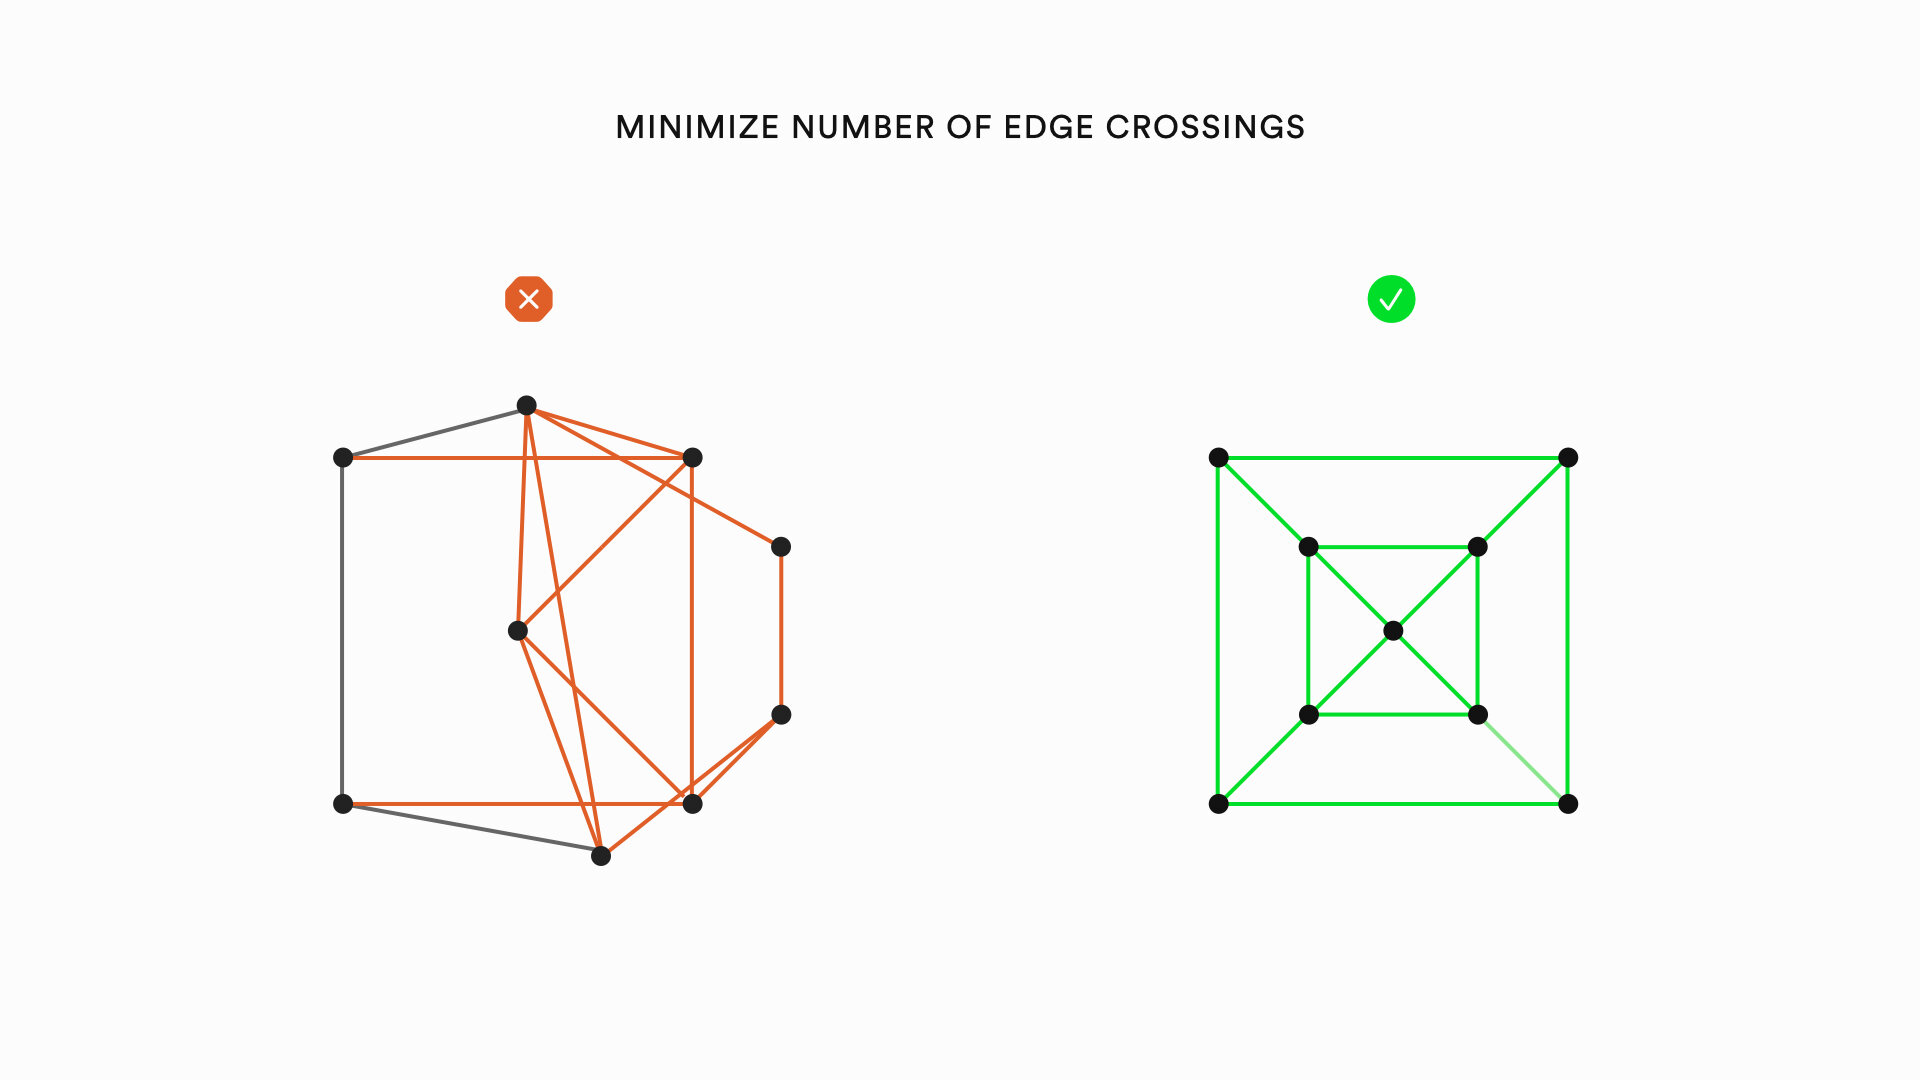
• Minimize number of edge crossings
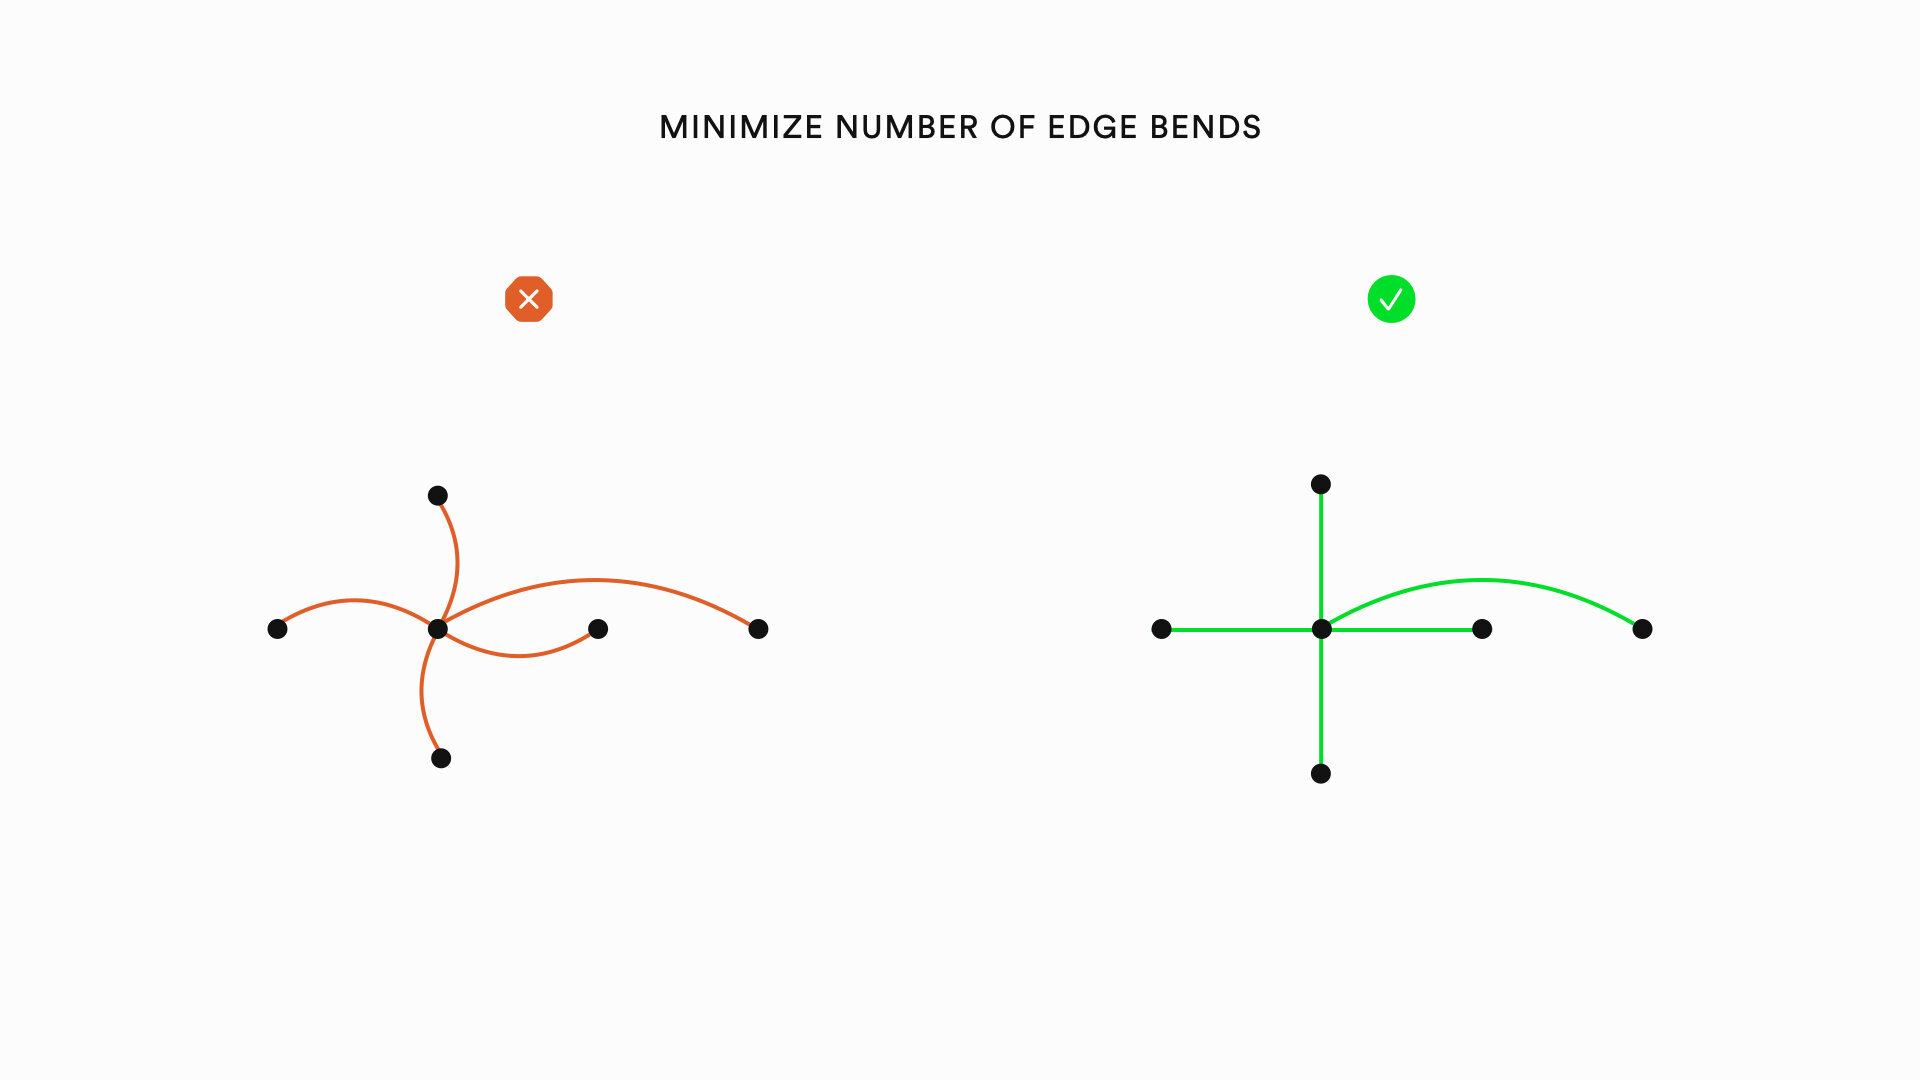
• Minimize number of edge bends
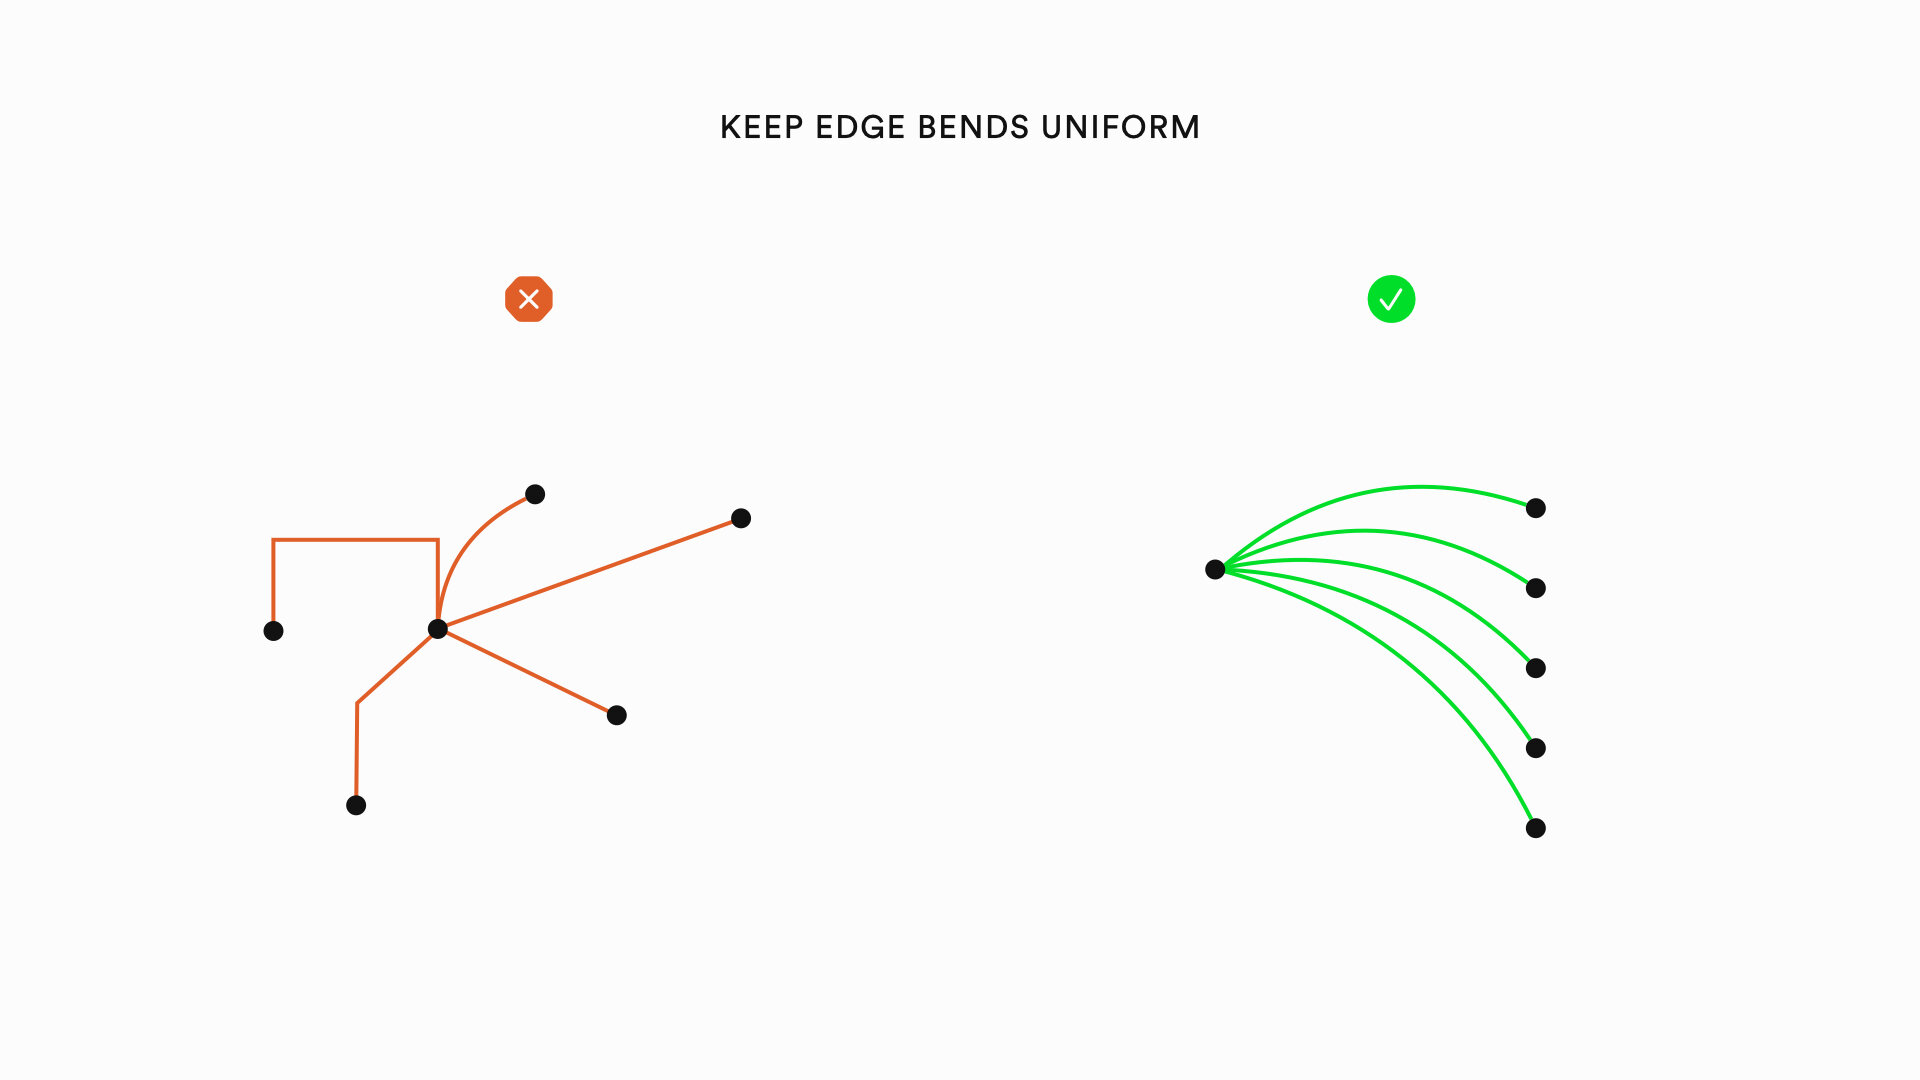
• Keep edge bends uniform
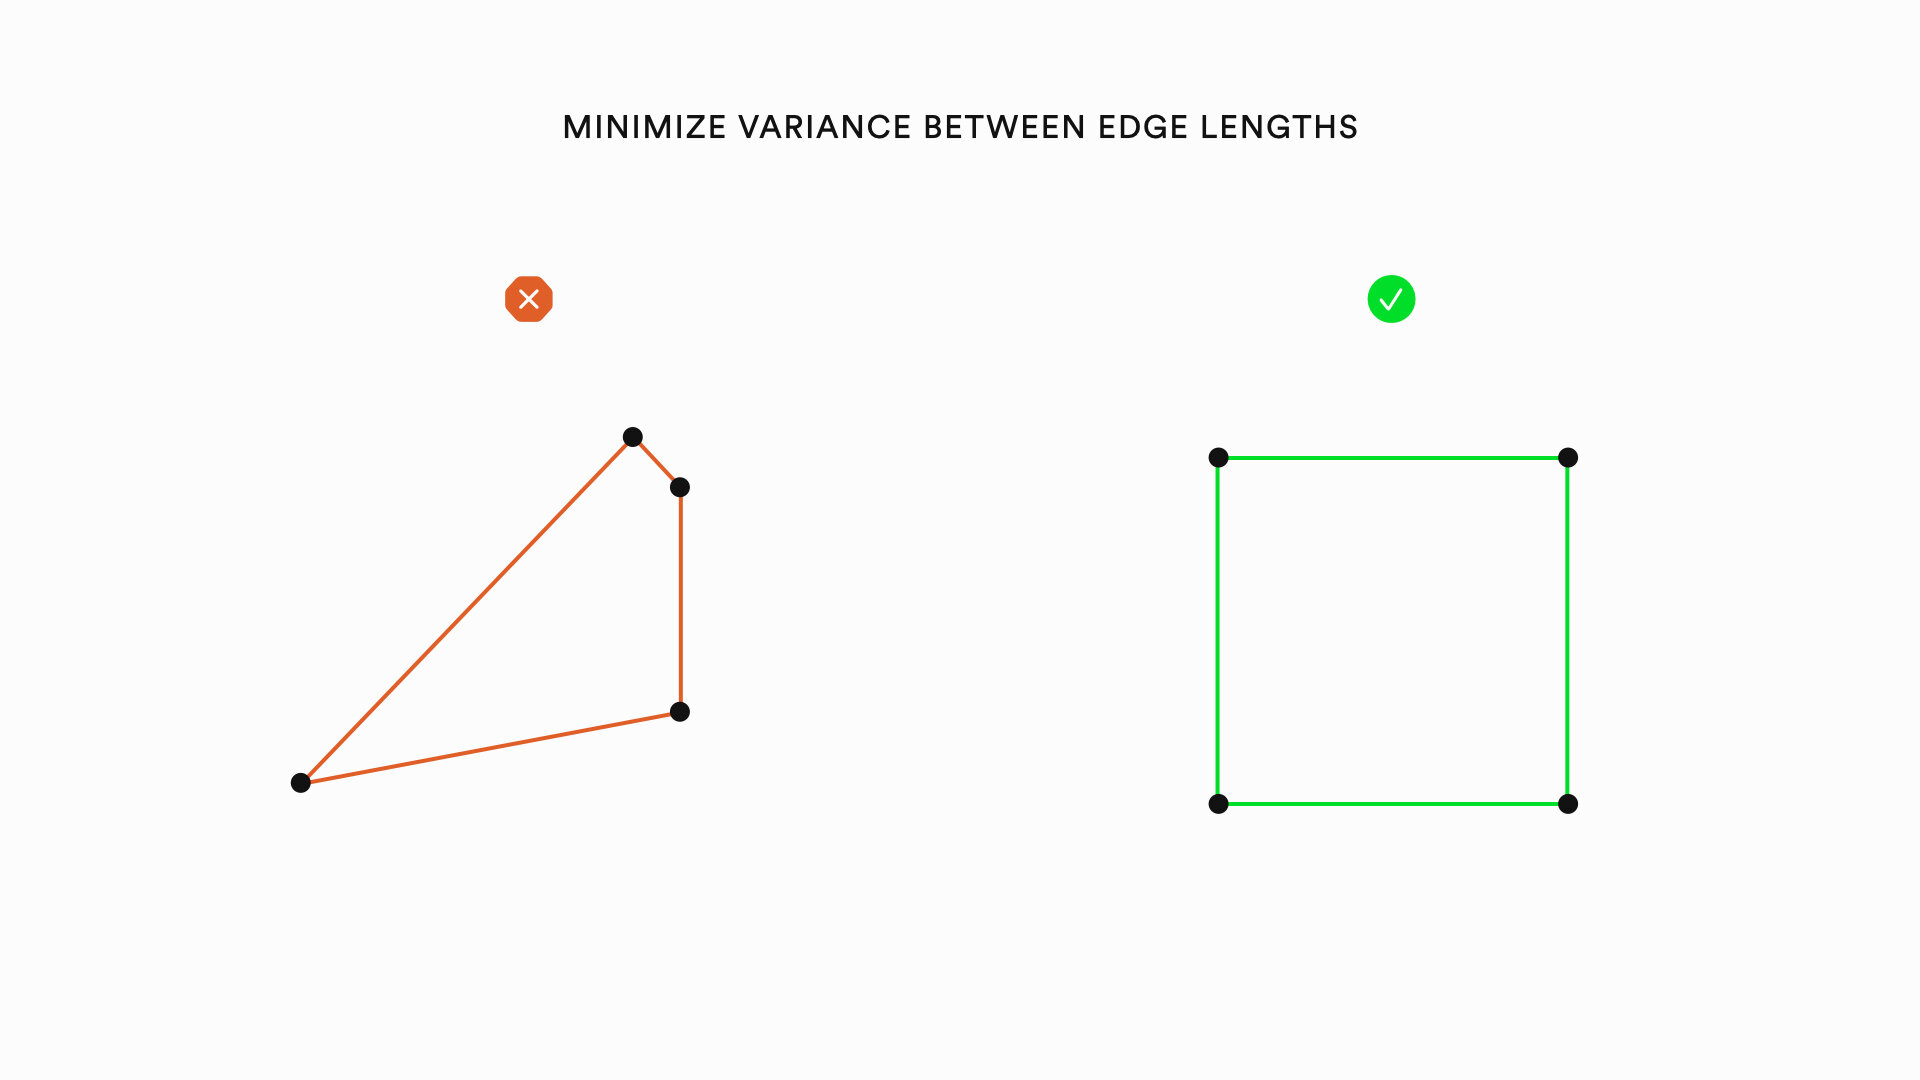
• Minimize variance between edge lengths
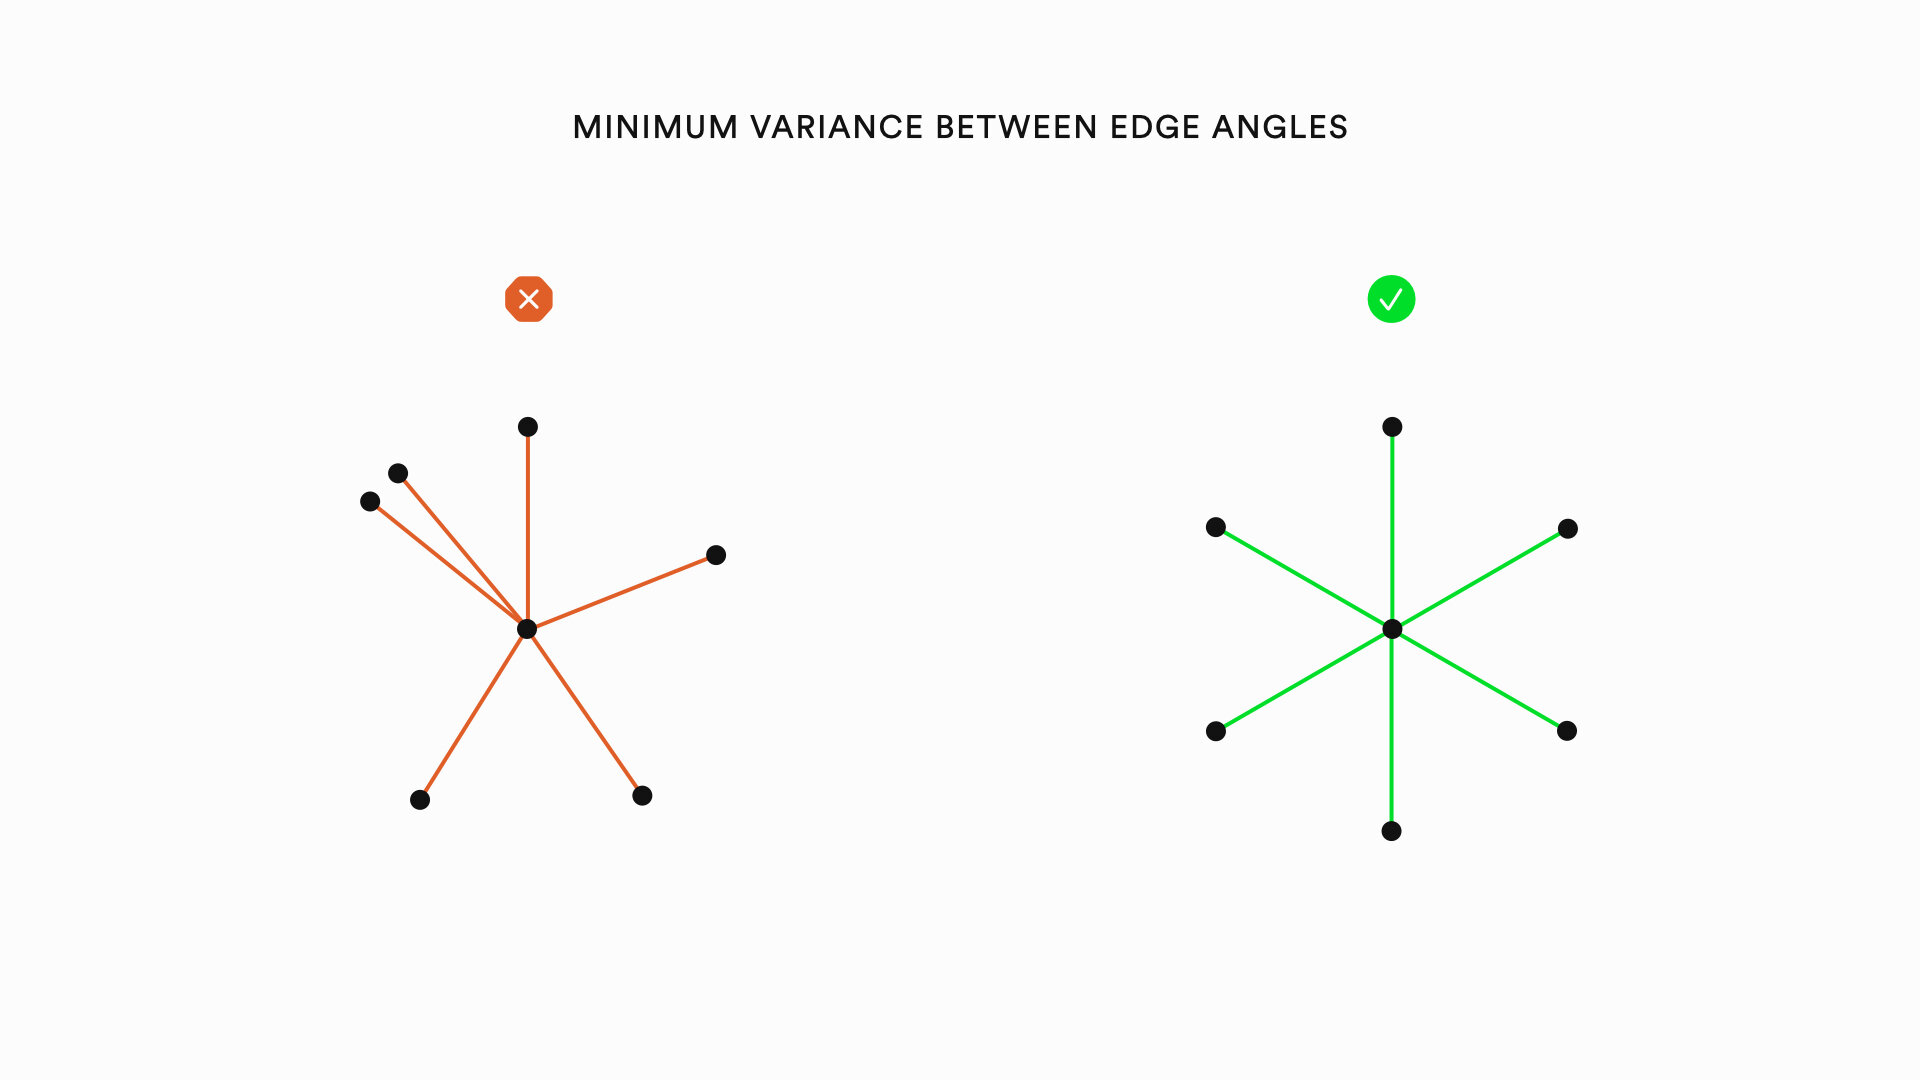
• Minimize variance between edge angles
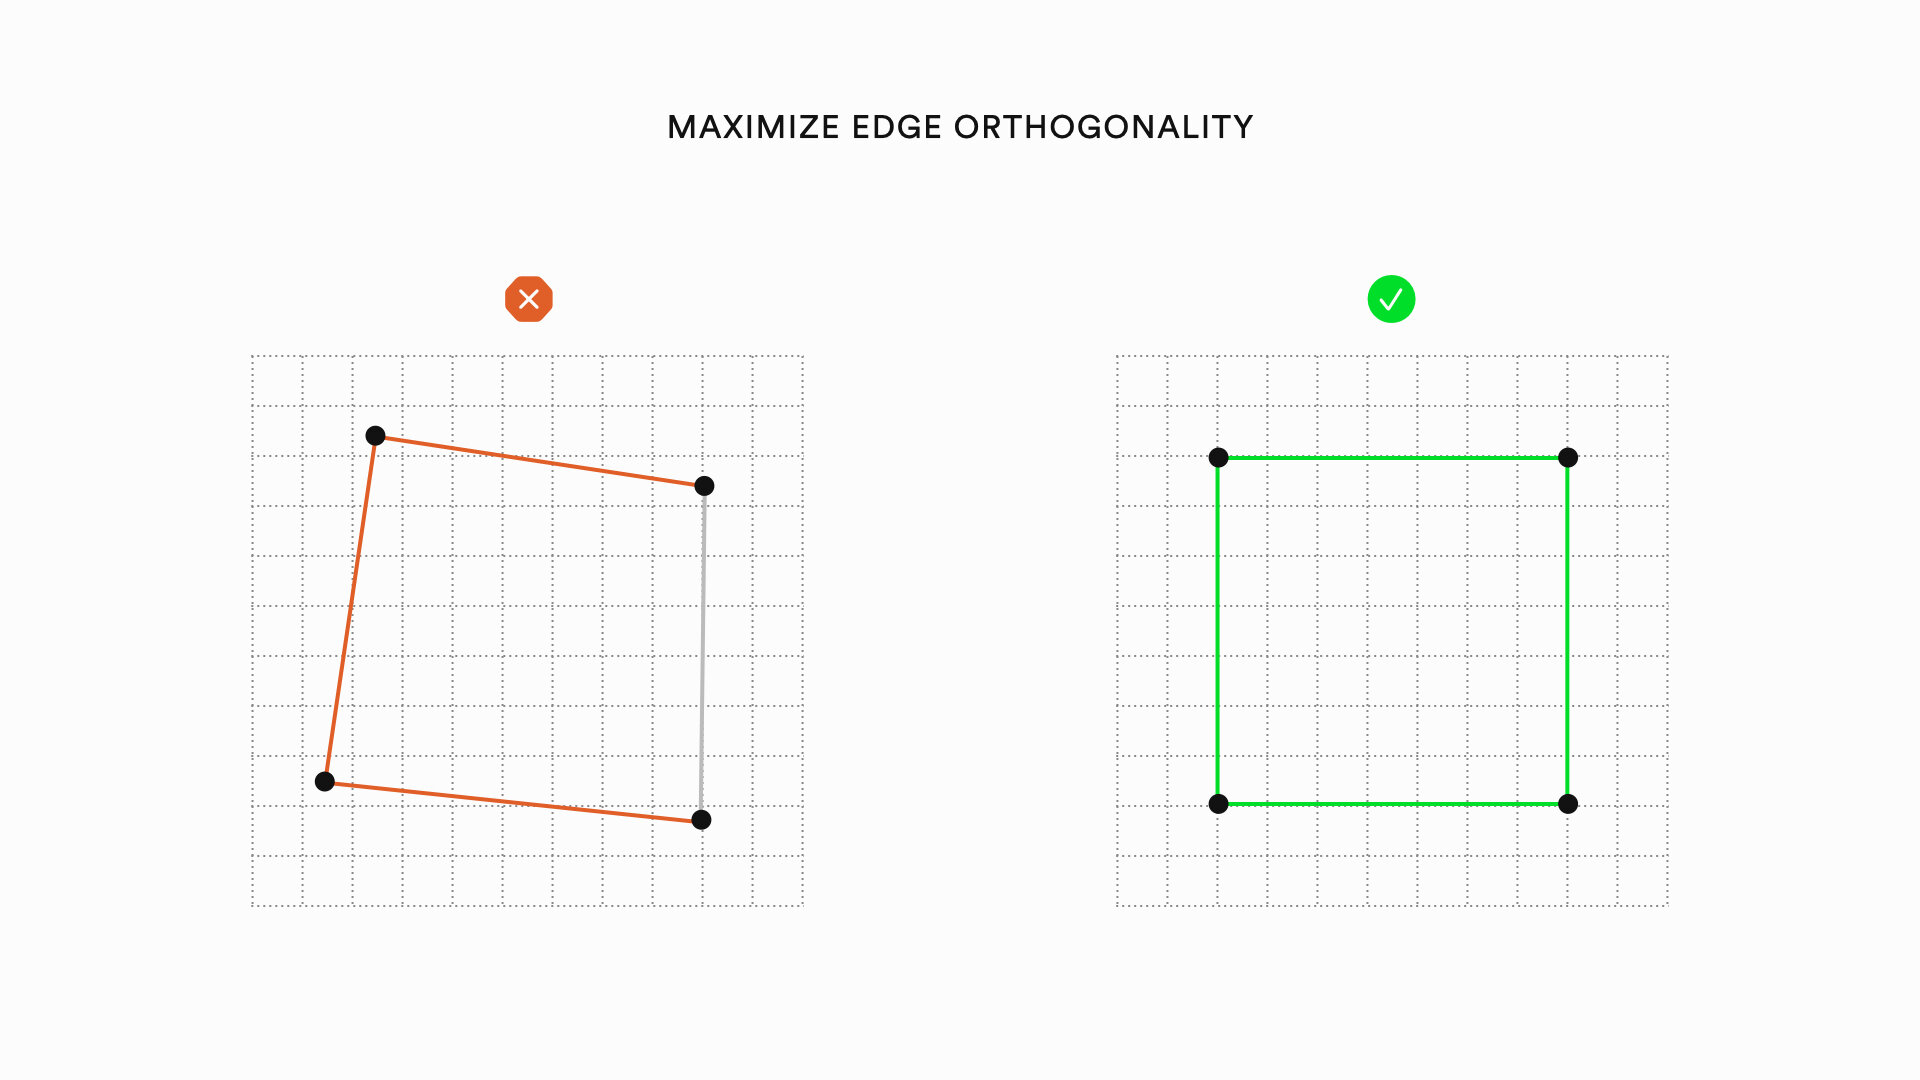
• Maximize edge orthogonality
Overall Layout
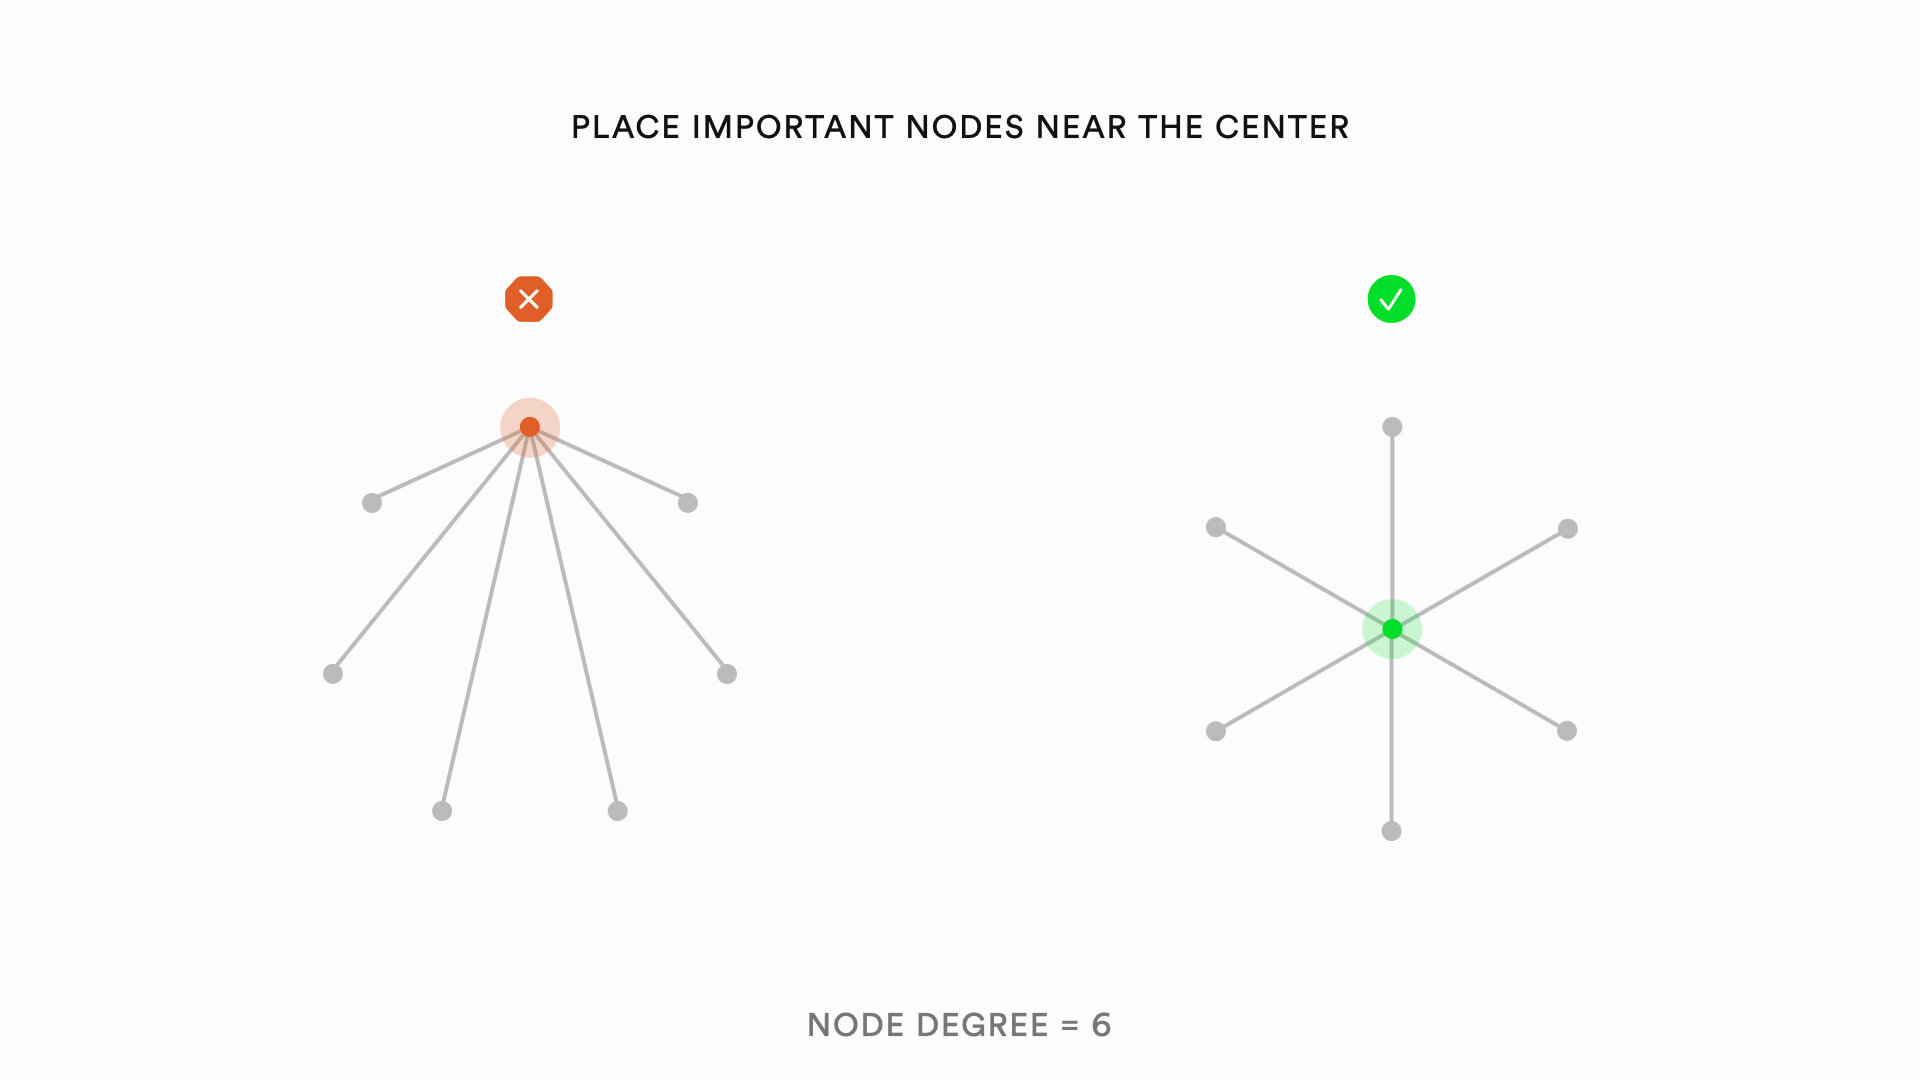
• Place important nodes near the center
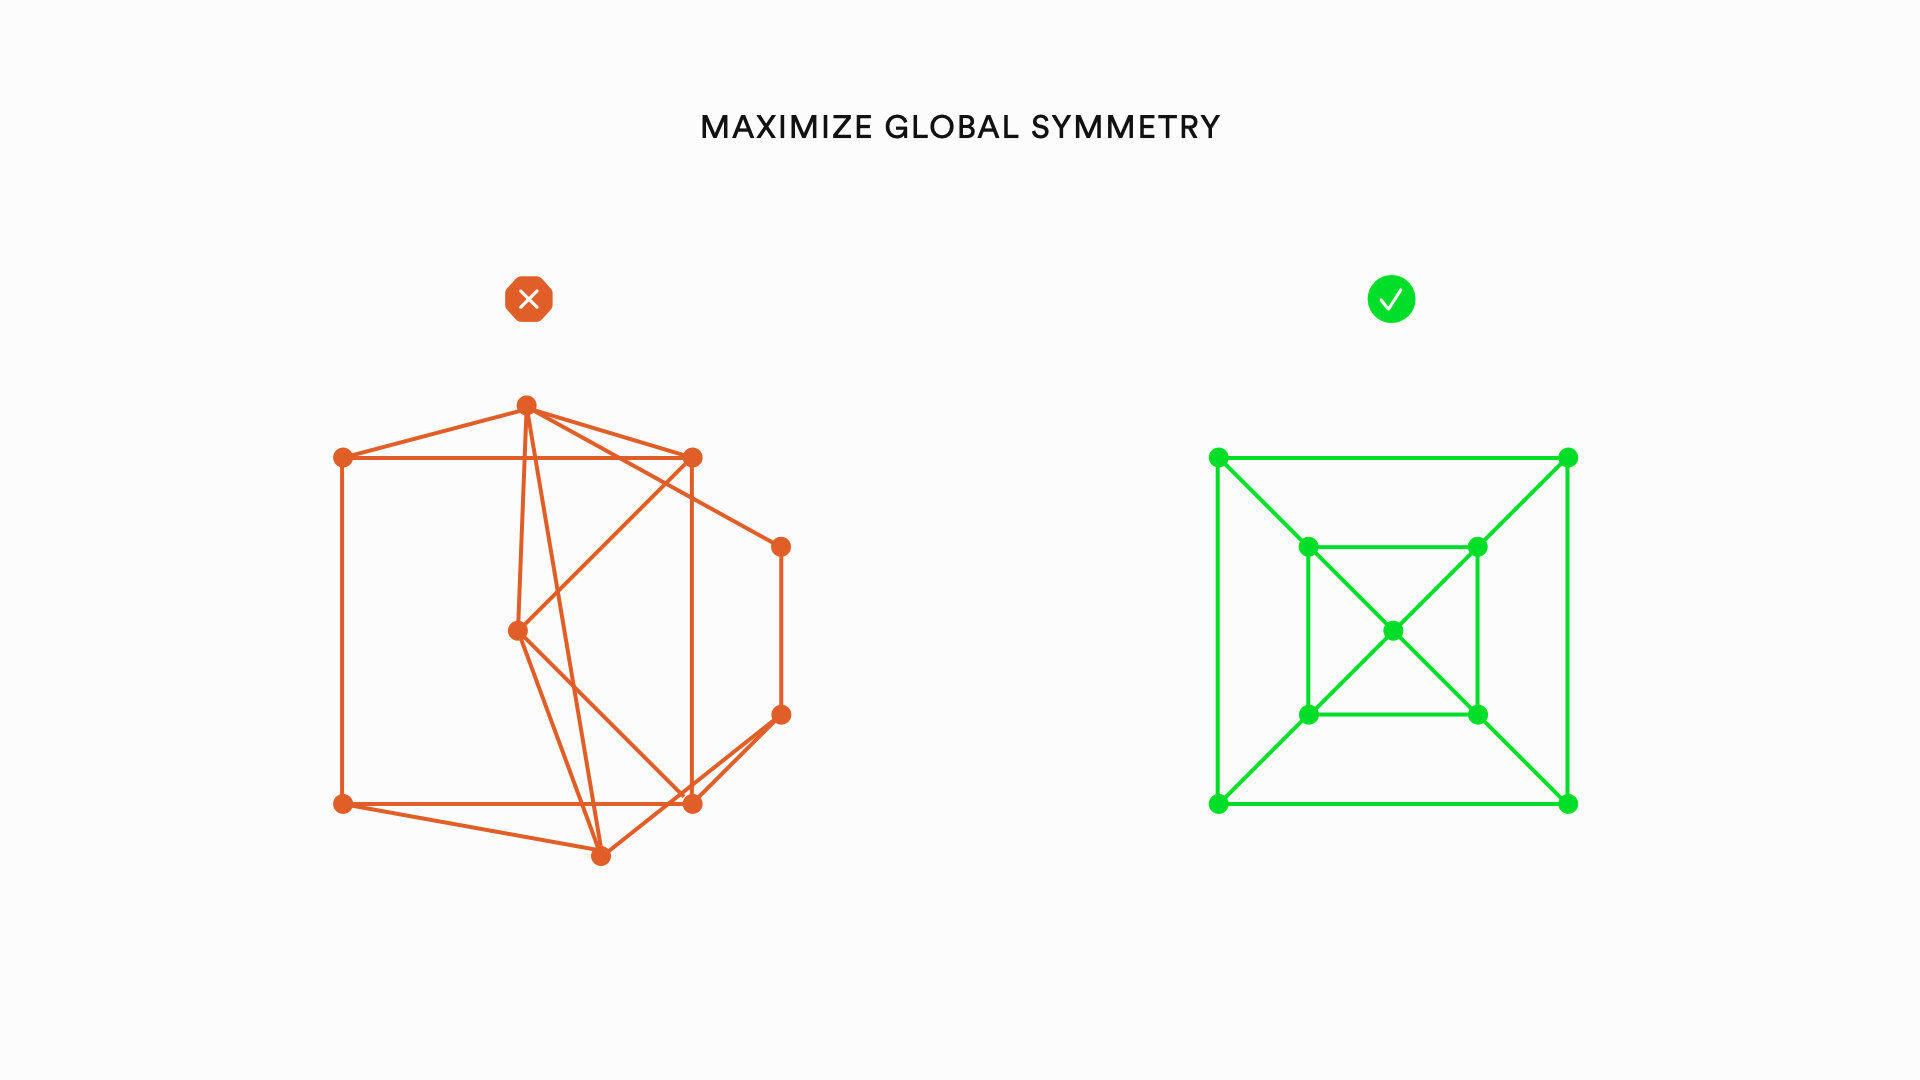
• Maximize global symmetry
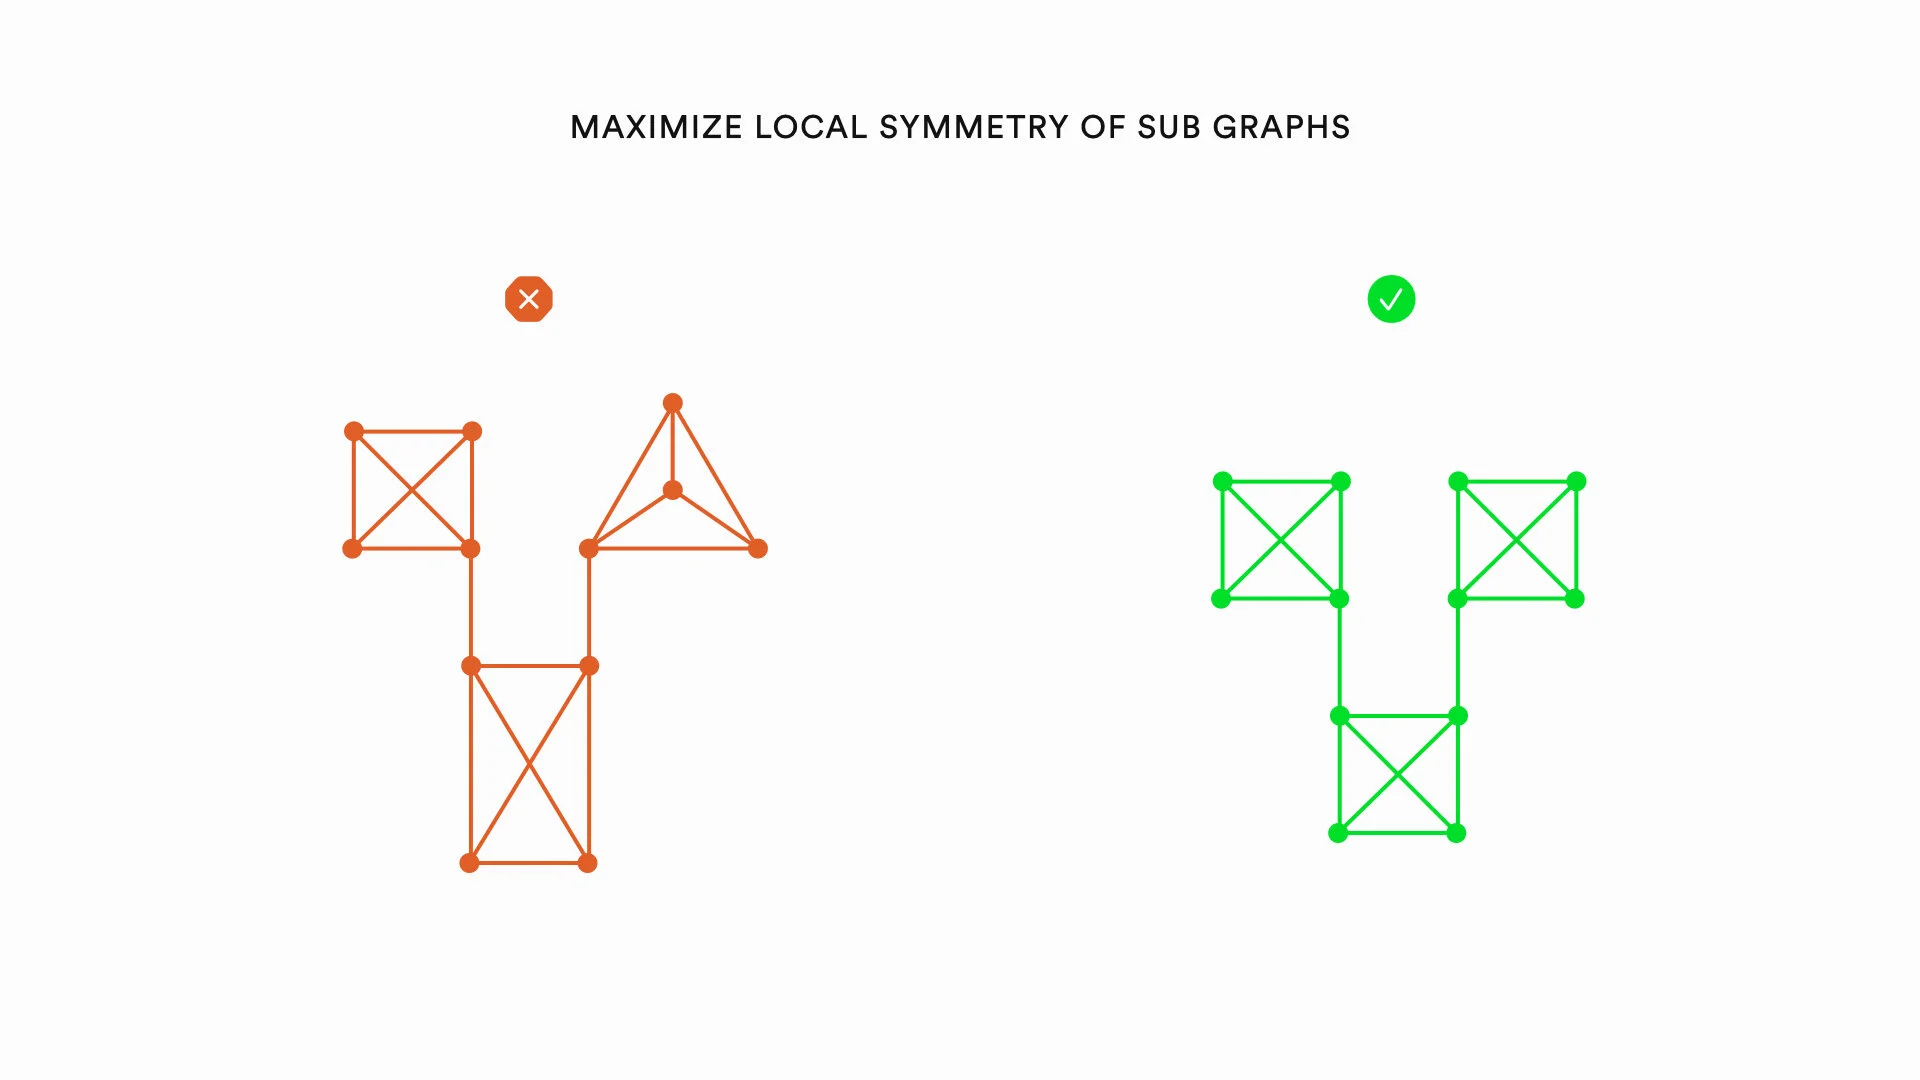
• Maximize local symmetry of subgraphs
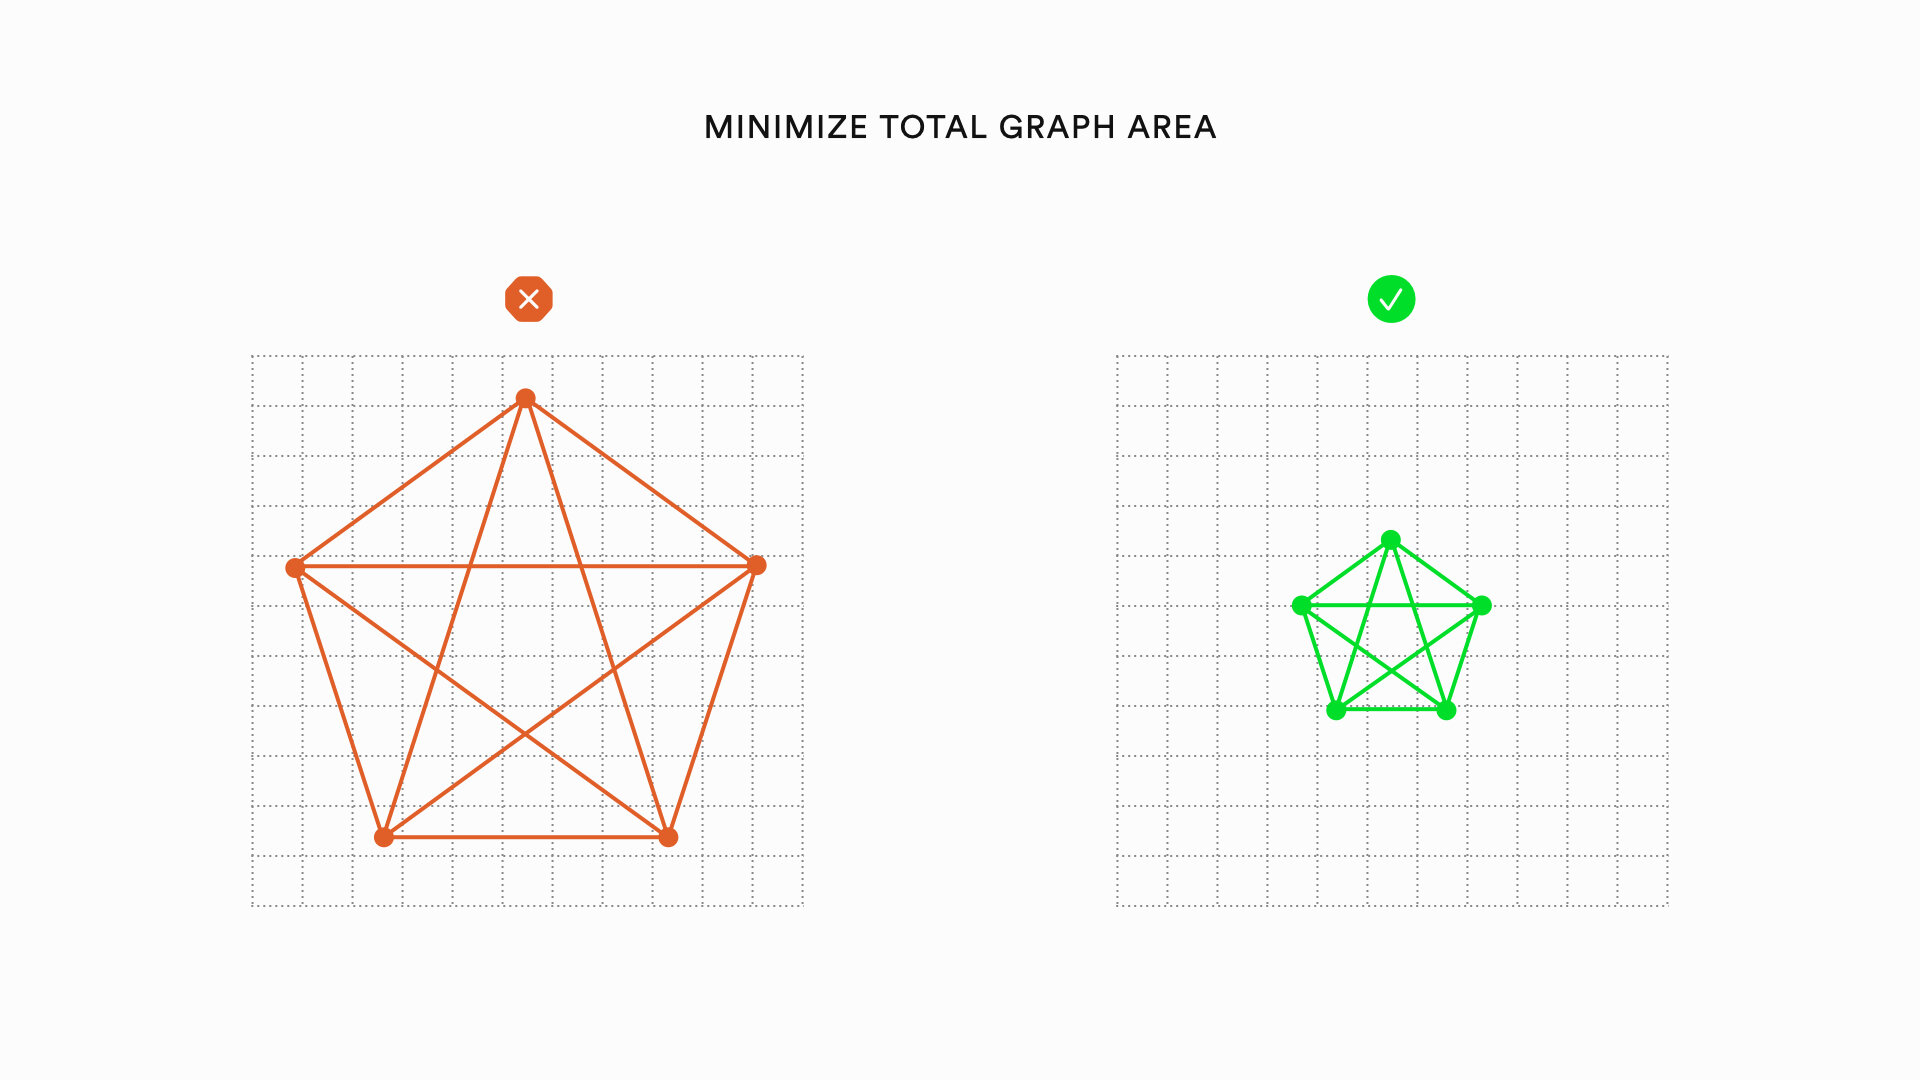
• Minimize total graph area
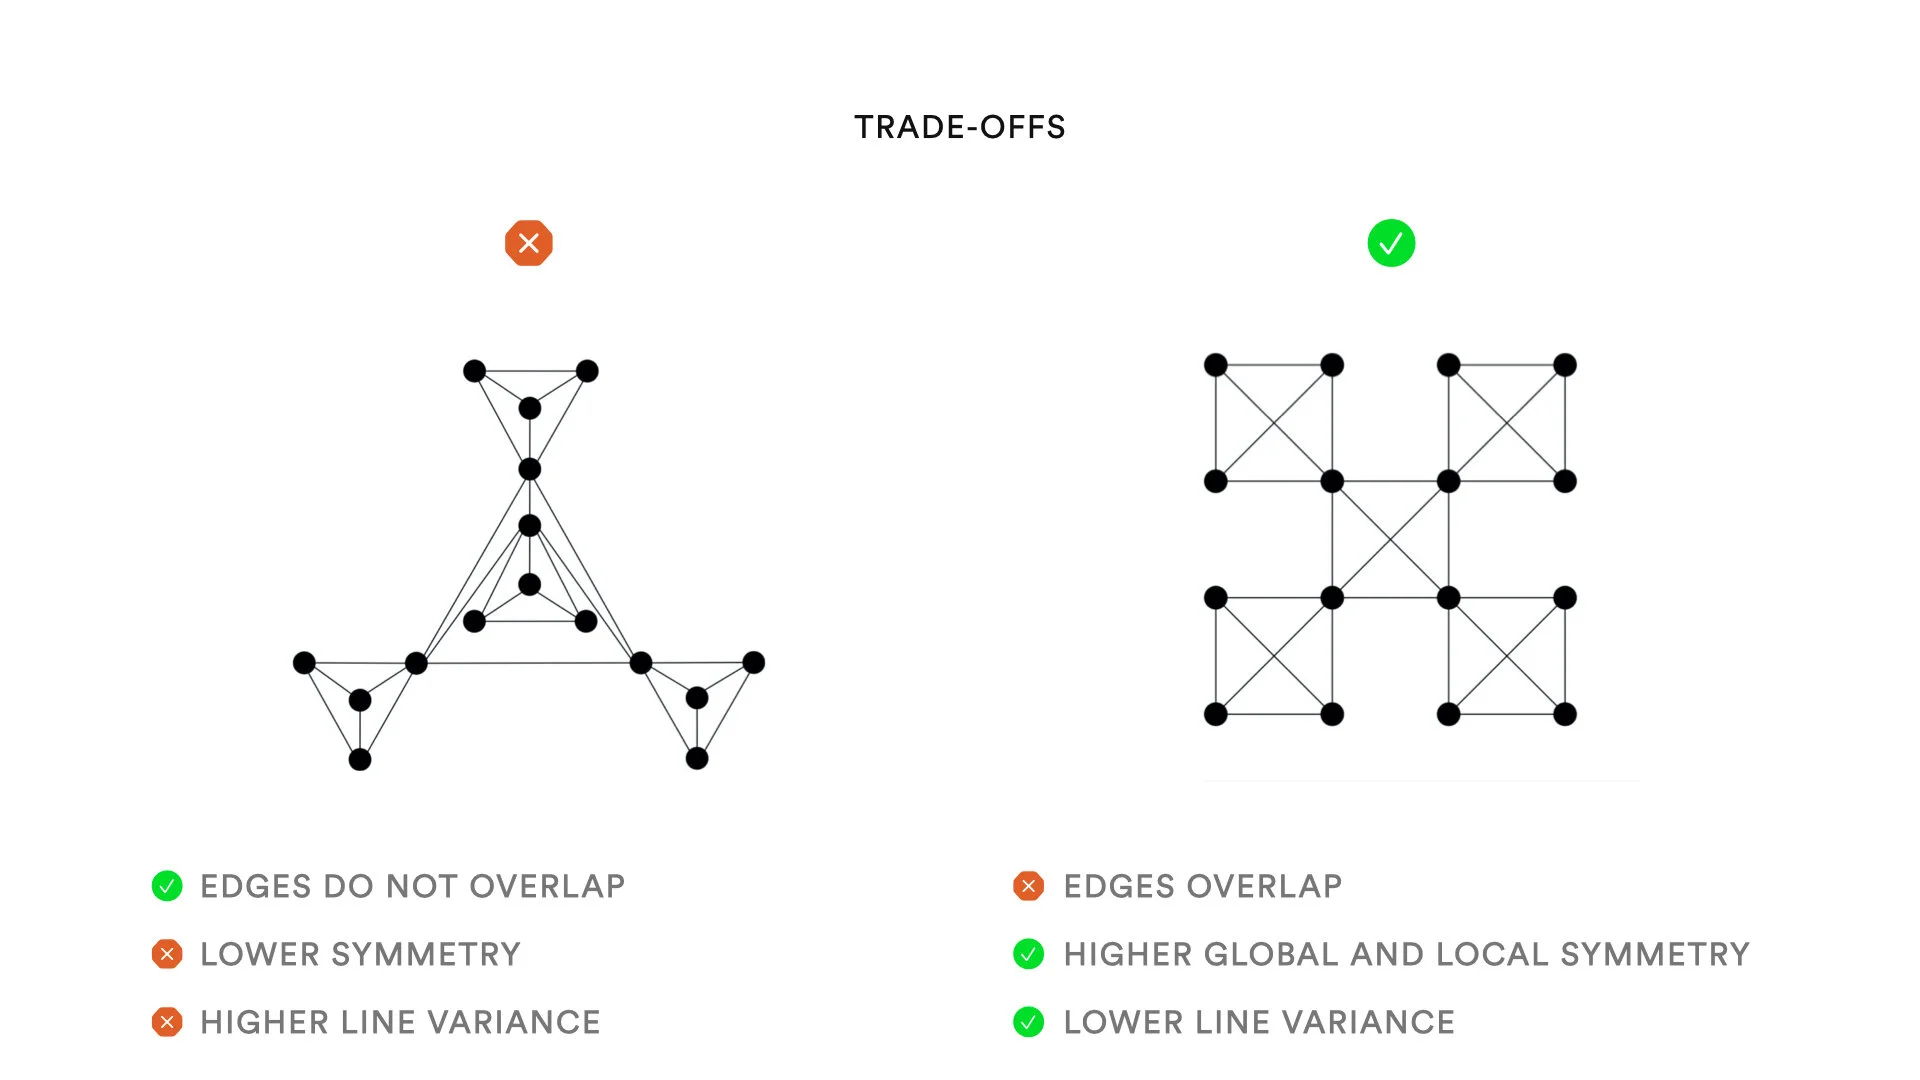
Trade-offs between heuristics
There are many layers of complexity when designing and evaluating graph visualizations. One of those complexities involves trade-offs between heuristics as you can see above. Developing metrics based on the aesthetic heuristics required providing a linear weighting across each heuristic.
Understanding Evaluation criteria
I built this tool to test our evaluations and fine-tune the evaluation criteria for the automatically generated graph visualizations. I only created evaluations for rectilinear, non-complete graphs. Different evaluations are needed for different graph types.

Testing Existing Graph Structures
My collaborators developed a system that utilizes existing graph algorithms to create visualizations from graph data. As our evaluation system improved, the generator would get better at selecting visualization parameters.

Advanced model of a computationally creative system.